PageSpeed Insights Primer
Having a fast website makes the difference between success and fail. To see how we're doing, let's use Google's PageSpeed Insights to analyze this blog.
This blog post is a continuous analysis of specific website to see how it's measures against Google's PageSpeed Insights.
The website we're analyzing is this exact blog, and the page in question is the home page.
The reason why we're doing a continuous analysis is to see over time if the adjustments we're making to the software is improving the speed and to what extend.
Note: The analysis for for this article only covers PageSpeed Insights. There are other good tools to see how fast your website loads. Two of those that I really like are GTMetrix and Pingdom's Page Speed Monitoring.
To fire up a new report, we can simply click the link below:
https://pagespeed.web.dev/report?url=https%3A%2F%2Feugene.fintechsystems.net
There are two tabs at the top, "Mobile" and "Desktop", we're collecting performance data in the table below:
Results Table
Date | Mobile | Desktop Performance |
|---|---|---|
11 Nov 2022 | 74/67/92/90 | 96/78/92/91 |
28 Oct 2022 | 75/67/100/90 | 94/78/100/91 |
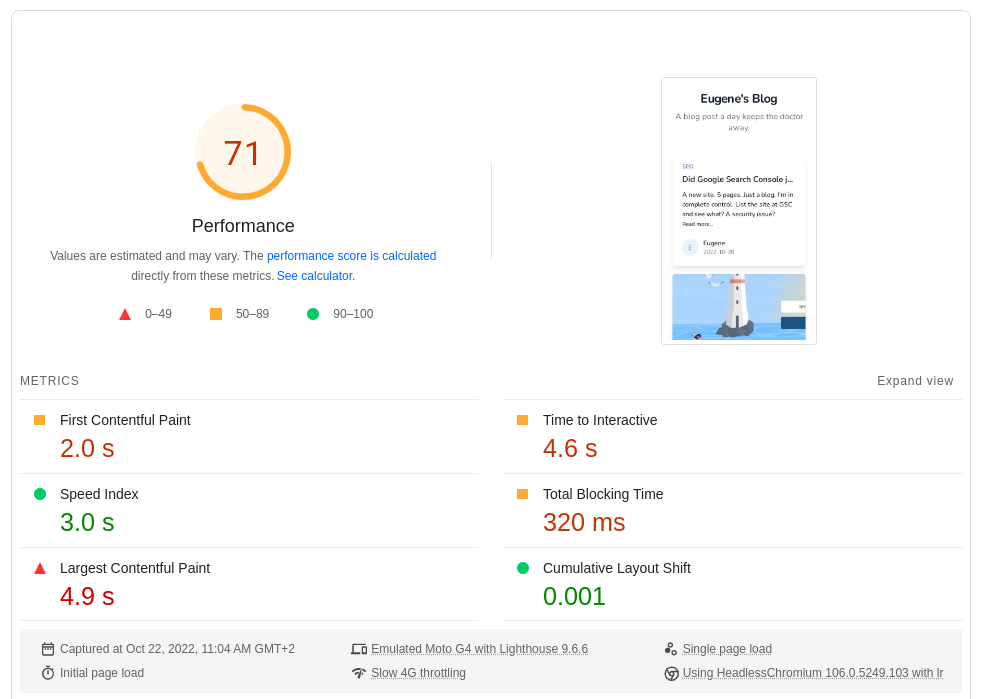
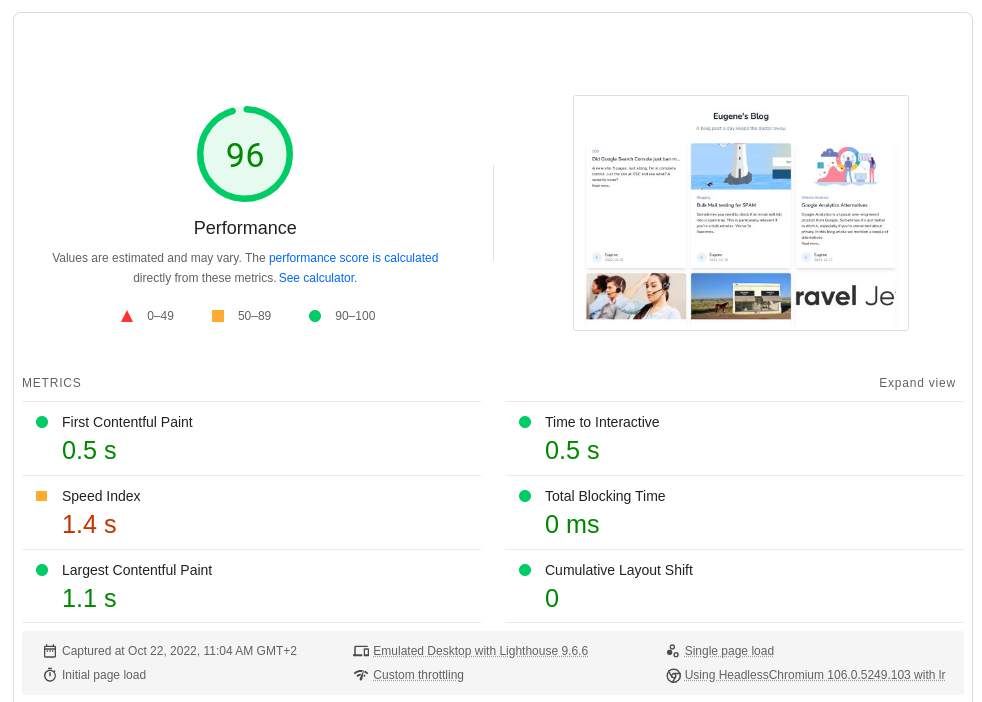
22 Oct 2022 | 71 | 96 |
3rd set of results
I didn't do much on the site at all except I was a bit curious as to how it compared with before and after. As far as I know, vaguely, these things are new:
Images are now WebP
Canonical URL was implemented
There is a custom 404 page
The best practices went down and when I looked I noticed one of the new articles (on BankyStatement), has a 404 for the WebP image. I just updated it with a filename that doesn't have space and brackets in.
2nd set of results
I was expecting much worse results from the 2nd test, because the home page currently doesn't have pagination and there are 14 blog posts on it. On the other hand My Blog now compresses and converts images to webp so image downloading shouldn't be an issue.
What I did find interesting is that apart from the general performance indicator, there are three other indicators for accessibility, best practices, and SEO. This is good because it gives one a more comprehensive overview of the results and I've decided to incorporate that into the results table.
Here is a screenshot of these useful indicators from the 2nd test's desktop view:

1st set of results
This was the first test we performed on the 22nd of October 2022.
The mobile results are 71. It's a fine result, but not great. I think one should aim for 80, and especially so if your site is useful for people on a mobile device.

The desktop result is 96. This is a great result:

As issues are reported we will try to address them.
Note: This post is updated from time to time to reveal if we're making progress or not.